Components of the “Forecast of Potential for High Sea Level In and Around Kahului Harbor, Maui”
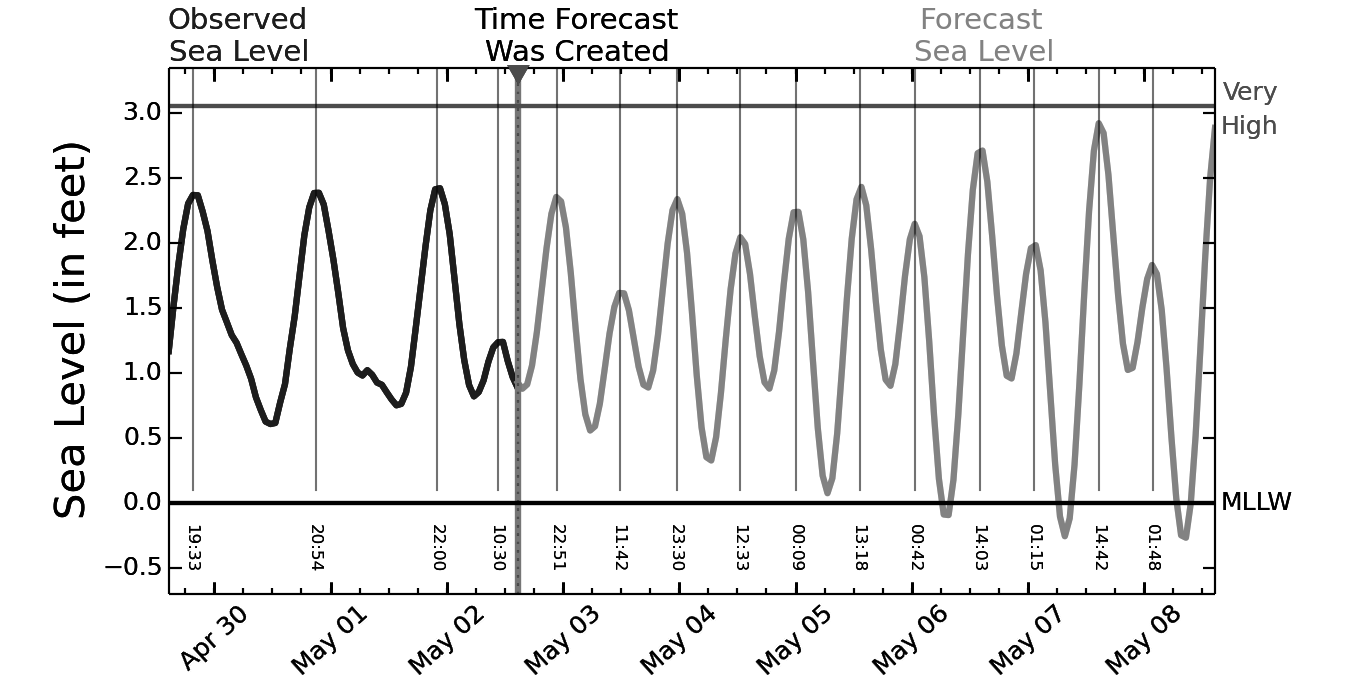
| Red Line in the Top Plot | This high sea level value has been calculated as follows. First, tsunami signals were edited out of the Observed Sea Level for the past ~15 years (1996-2011). Then, the linear trend of the 15-year record was estimated and subtracted. The Higher High Water (HHW description) for each day was extracted. The value of sea level that was exceeded by only 2% of these HHWs was determined. This 2% exceedance value was added to the mean sea level based on the prior two years (2010-2011) of data to yield the sea level value plotted as the red line in the top plot. When this high sea level height is exceeded, flooding of the lowest lying land is expected. See the example at the bottom of this page of flooding during an very high sea level event. |
| Dark Blue Curve in the Top Plot | This is the Observed SL, in feet, at Kahului Hbr. for the 3 days (in hourly increments) prior to the time this plot was created (indicated by the orange yellow vertical dotted line). The Observed SL is measured relative to MLLW (Mean Low Low Water), which is a well-defined reference level (NOAA datum description) |
Observed SL = Calculated Tide + Observed Non-Tidal Sea Level
| Cyan Curve in the Top Plot | This is the Forecast Sea Level (SL), in feet, at Kahului Hbr., for the next 6 days (in hourly increments). The forecast is made relative to MLLW (Mean Low Low Water), which is a well-defined reference level (NOAA datum description). The forecast is updated every 4 hours. |
Forecast SL = Calculated Tide + Forecast Non-Tidal Sea Level
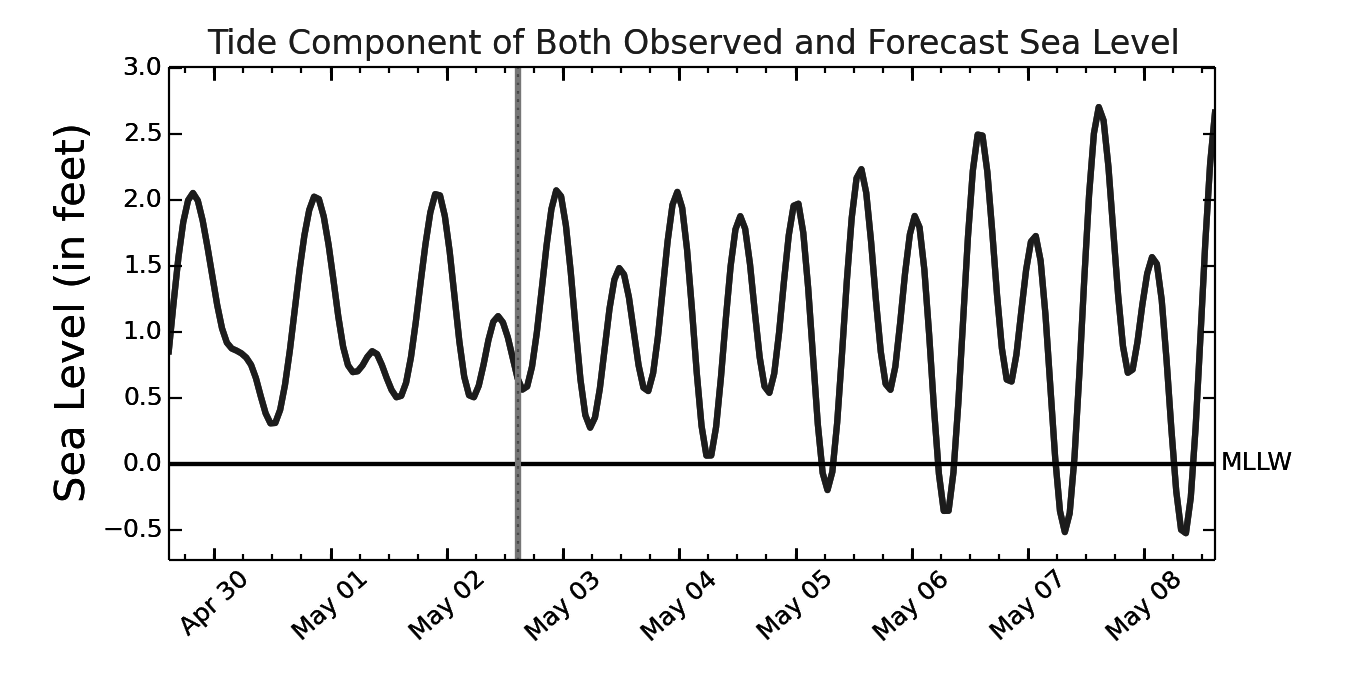
| Magenta Curve in the Middle Plot | This is the Calculated Tide component of sea level for all 9 days displayed. Tidal variations of sea level are calculated from analyses of prior observed sea level data. For Kahului Hbr., approximately 20 years of data, from May, 1990, through April, 2010, were employed to determine the tidal constituents. From these constituents, the tidal component of sea level can be very accurately predicted many years into the future. |
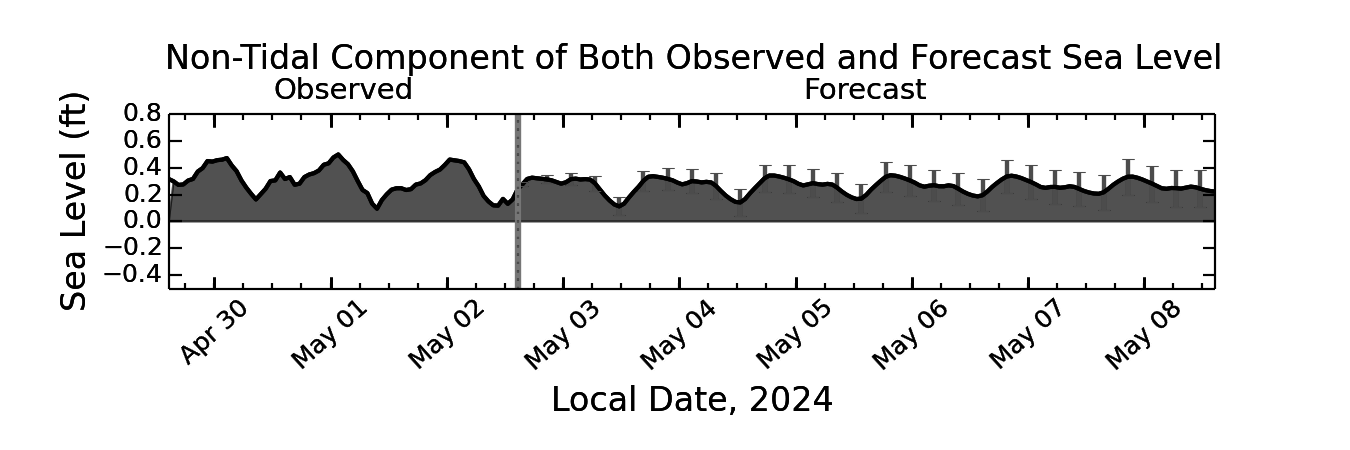
| Filled Black Curve in the Bottom Plot |
This is the Non-Tidal component of either Observed SL or Forecast SL note the small amplitude range of the Non-Tidal component (typically around 1/4 of a foot) compared to the range of about 3 feet for the total SL signal. This shows that, in general, SL variations are dominated by the tides. However, there can be significant SL height changes (occasionally, up to one foot or more) due to either surface wave-driven setup, storm surge, strong offshore currents (eddies), or, of course, tsunamis. A recent example of high (about 1/2 foot), slowly varying, non-tidal sea level can be found below. The Observed Non-Tidal Sea Level (SL) is, of course, simply the Observed SL minus the Calculated Tide The Forecast Non-Tidal SL is based on a mathematical projection into the future of the Observed Non-Tidal SL from the past 6 days. The main components of the Observed Non-Tidal SL that are specifically accounted for in the forecasts are as follows: (i) the daily and semi-daily variations in SL that result from, for instance, forcing by the wind, by solar heating, and by set-up due to surface gravity wave swell; and, (ii) changes in SL that occur over several days or more due, for instance, to open ocean currents hitting the island. |
| Vertical Red Lines in the Bottom Plot | These are the confidence intervals for the Forecast Non-Tidal SL. The length of these lines (from end to end) represents twice the standard deviation of the difference between the Observed Non-Tidal SL and the Forecast Non-Tidal SL for the year from October, 2008, to October, 2009. The true Non-Tidal SL, once measured, can be expected to fall within the limits of the red lines approximately two times out of three. Doubling the length of the red lines will ensure that approximately 19 out of 20 true, observed values will fall within those confidence limits. |
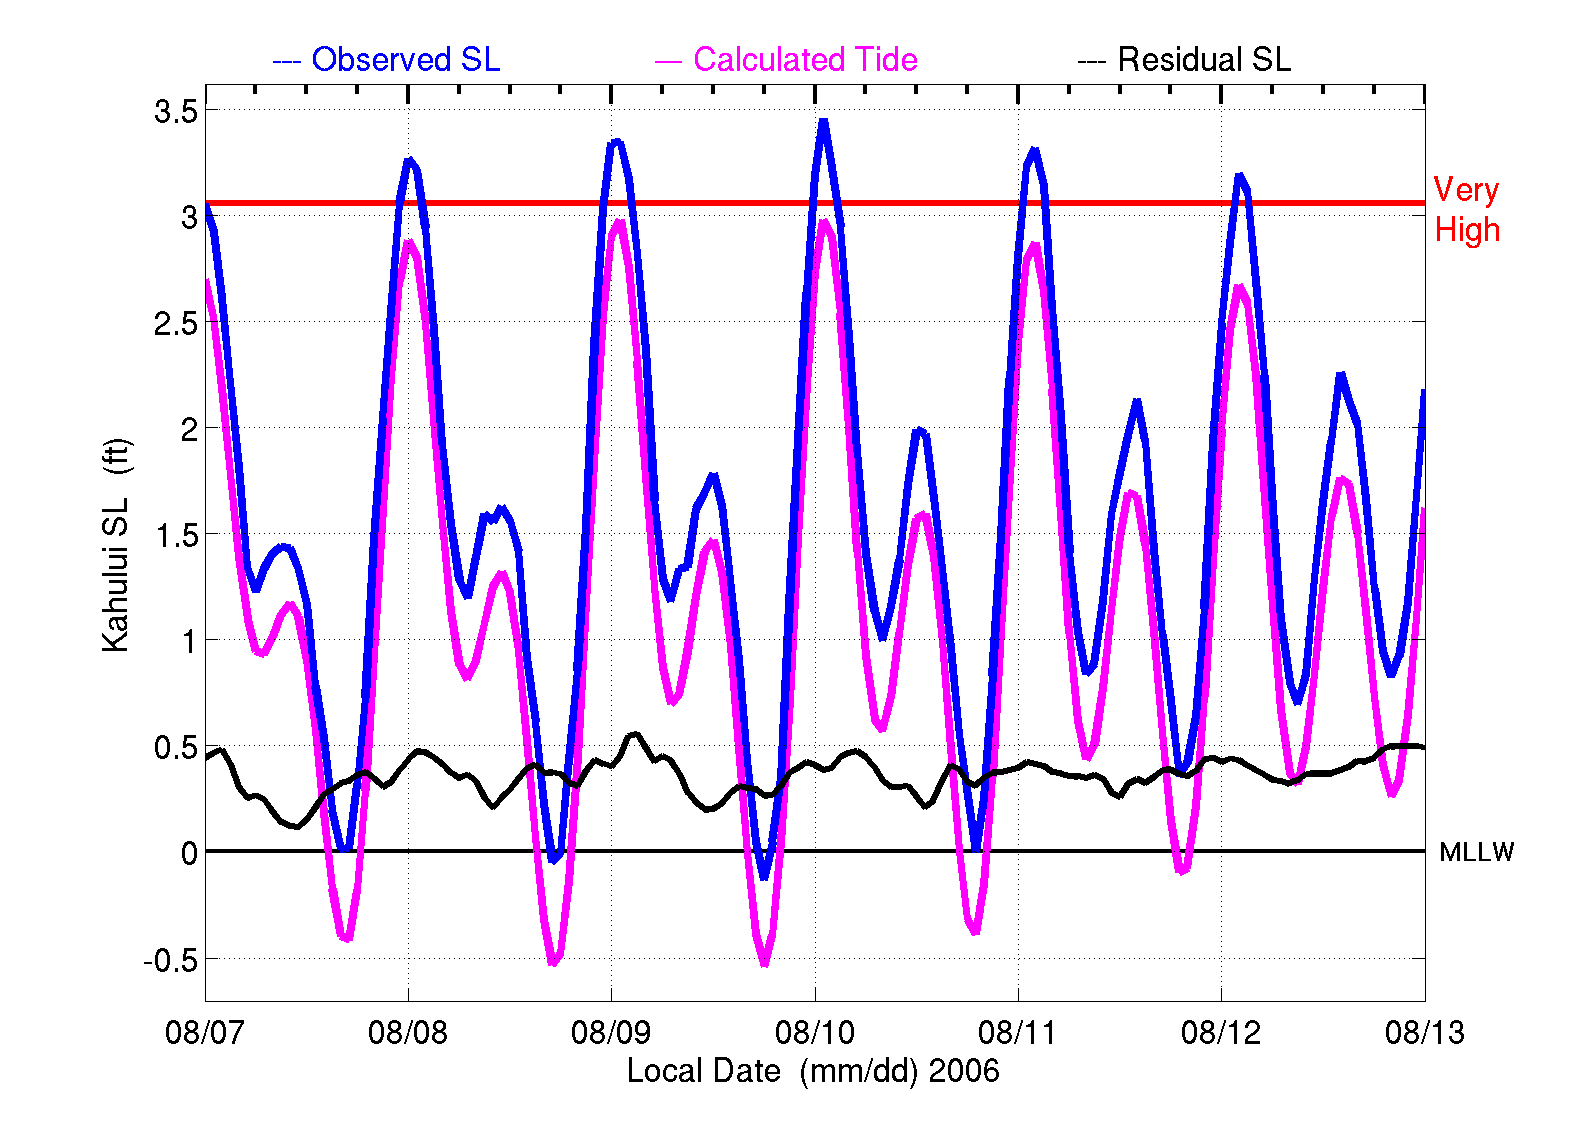
An Example of Kahului Hbr. Sea Level Driven to Higher Levels by a Multi-Day, Non-Tidal Sea Level Surge